[ad_1]
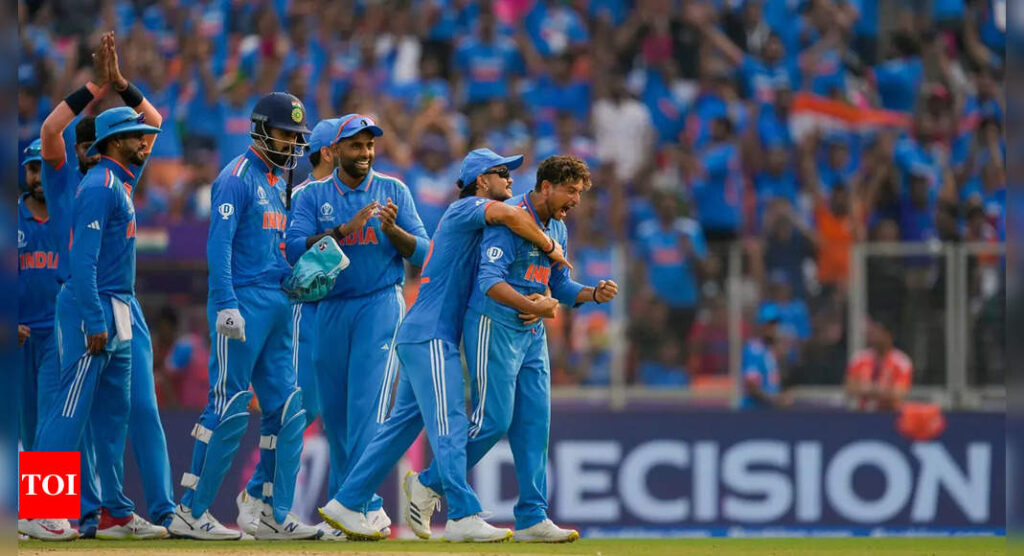
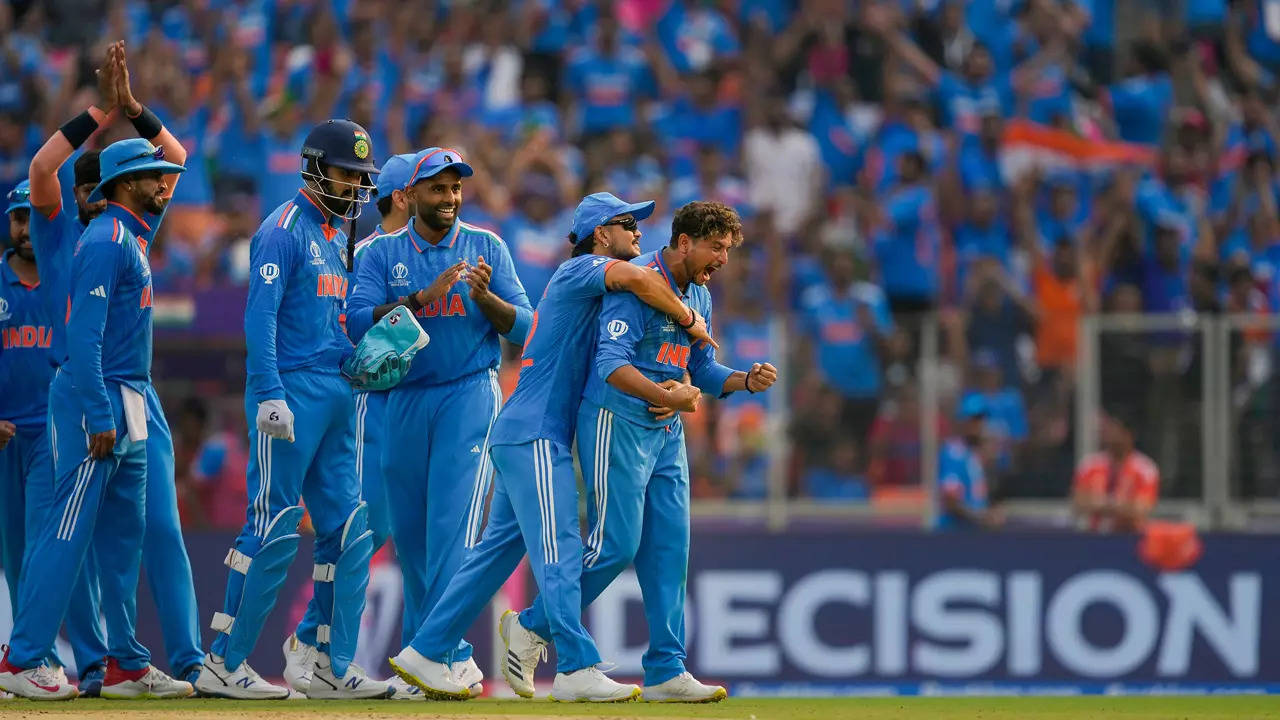
India are top of the standings with six points from three wins in as many matches, having beaten Australia, Afghanistan and Pakistan. But what must be equally heartening for chief coach Rahul Dravid and his staff will be India topping the list of teams who have bowled most economically.
So far 14 matches have been played in the ongoing World Cup.
Watch: Virat Kohli gifts Pakistan captain Babar Azam a signed jersey
In three matches, the Indian bowlers have bowled 142.2 overs and conceded 648 runs at an economy rate of 4.55. The 28 wickets claimed by the Indian bowlers is also the most in the tournament so far (calculated after the Australia vs Sri Lanka match on October 16).
New Zealand are second in that list, conceding 748 runs in three matches at an economy rate of 5.10. They have taken 27 wickets.
India vs Pakistan: Rohit Sharma, bowlers star in India’s dominant 7-wicket win
Five-time champions Australia have bowled 134.5 overs in their three matches and leaked 709 runs at an economy rate of 5.25. They have claimed 20 wickets.
Top six teams in terms of economy rate (stats after Australia vs Sri Lanka match):
| TEAM | MATCHES | OVERS | RUNS | WICKETS | AVG | SR | ECON | 4WI | BEST |
| INDIA | 3 | 142.2 | 648 | 28 | 23.14 | 30.5 | 4.55 | 1 | 4/39 |
| NEW ZEALAND | 3 | 146.3 | 748 | 27 | 27.70 | 32.5 | 5.10 | 1 | 5/59 |
| AUSTRALIA | 3 | 134.5 | 709 | 20 | 35.45 | 40.4 | 5.25 | 1 | 4/47 |
| AFGHANISTAN | 3 | 110.1 | 634 | 15 | 42.26 | 44.0 | 5.75 | 0 | 3/37 |
| SOUTH AFRICA | 2 | 85.4 | 494 | 20 | 24.70 | 25.7 | 5.76 | 0 | 3/33 |
| ENGLAND | 3 | 134.3 | 784 | 19 | 41.26 | 42.4 | 5.82 | 1 | 4/43 |
Stats courtesy: Rajesh Kumar
[ad_2]
Source link


More Stories
Australia exposed India’s little chinks in World Cup final: Sanjay Manjrekar | Cricket News
Rahul Dravid, BCCI engage in discussion but board inclined towards new coach | Cricket News
IPL 2024: Delhi Capitals retain Prithvi Shaw | Cricket News